Champ - N. Harold Cham's 65C02 Profiler
This is a 6502/65C02 emulator / profiler that enables you to really get to know your APPLE ][ HiRes Graphics Mode Demo.
Features
- full, cycle-accurate 65C02 emulation
- screen output as animated GIF with exact frame timing
- calculation of average frame rate
- see how much time is spent in which subroutine
- watch variables (single variables or pairs)
- no required dependencies except Ruby, gcc and Merlin32
- optional: GraphViz if you want a call graph
Usage
First, make sure you have gcc, ruby and Merlin32 installed. You need to prepare a YAML file to tell champ about all source and object files and their memory locations.
Take plot3d.yaml for example (using Marc A. Golombeck's excellent 3D-Demo):
load:
    0x6000: plot3d/plot3d242.s
    0x1200: plot3d/multtab.s
    0x8400: plot3d/ldrwtab.s
    0x8900: plot3d/SINETABLE
    0x8b00: plot3d/object2.s
    0x9000: plot3d/object1.s
    0x9500: plot3d/FONT
    0xb600: plot3d/projtab.s
entry: ENTRY
instant_rts:
    - LOAD1
We specified some source files (which will get compiled automatically) and some object files along with their locations in memory (load). We also specified the entry point for our program (entry), this can be a label or an address.
Furthermore, we can disable subroutines by replacing the first opcode with a RTS (instant_rts). This is necessary in some cases because Champ does not emulate hardware and thus can not load data from disk, for example.
Running the profiler
To start champ, type:
$ ./champ.rb --max-frames 100 plot3d.yaml
This will run the emulator and write the HTML report to report.html. If you do not specify the maximum number of frames, you can still cancel the emulator by pressing Ctrl+C at any time. If you need fast results and don't need the animated GIF of all frames, specify the --no-animation flag, which will still give you all the information but without the animation.
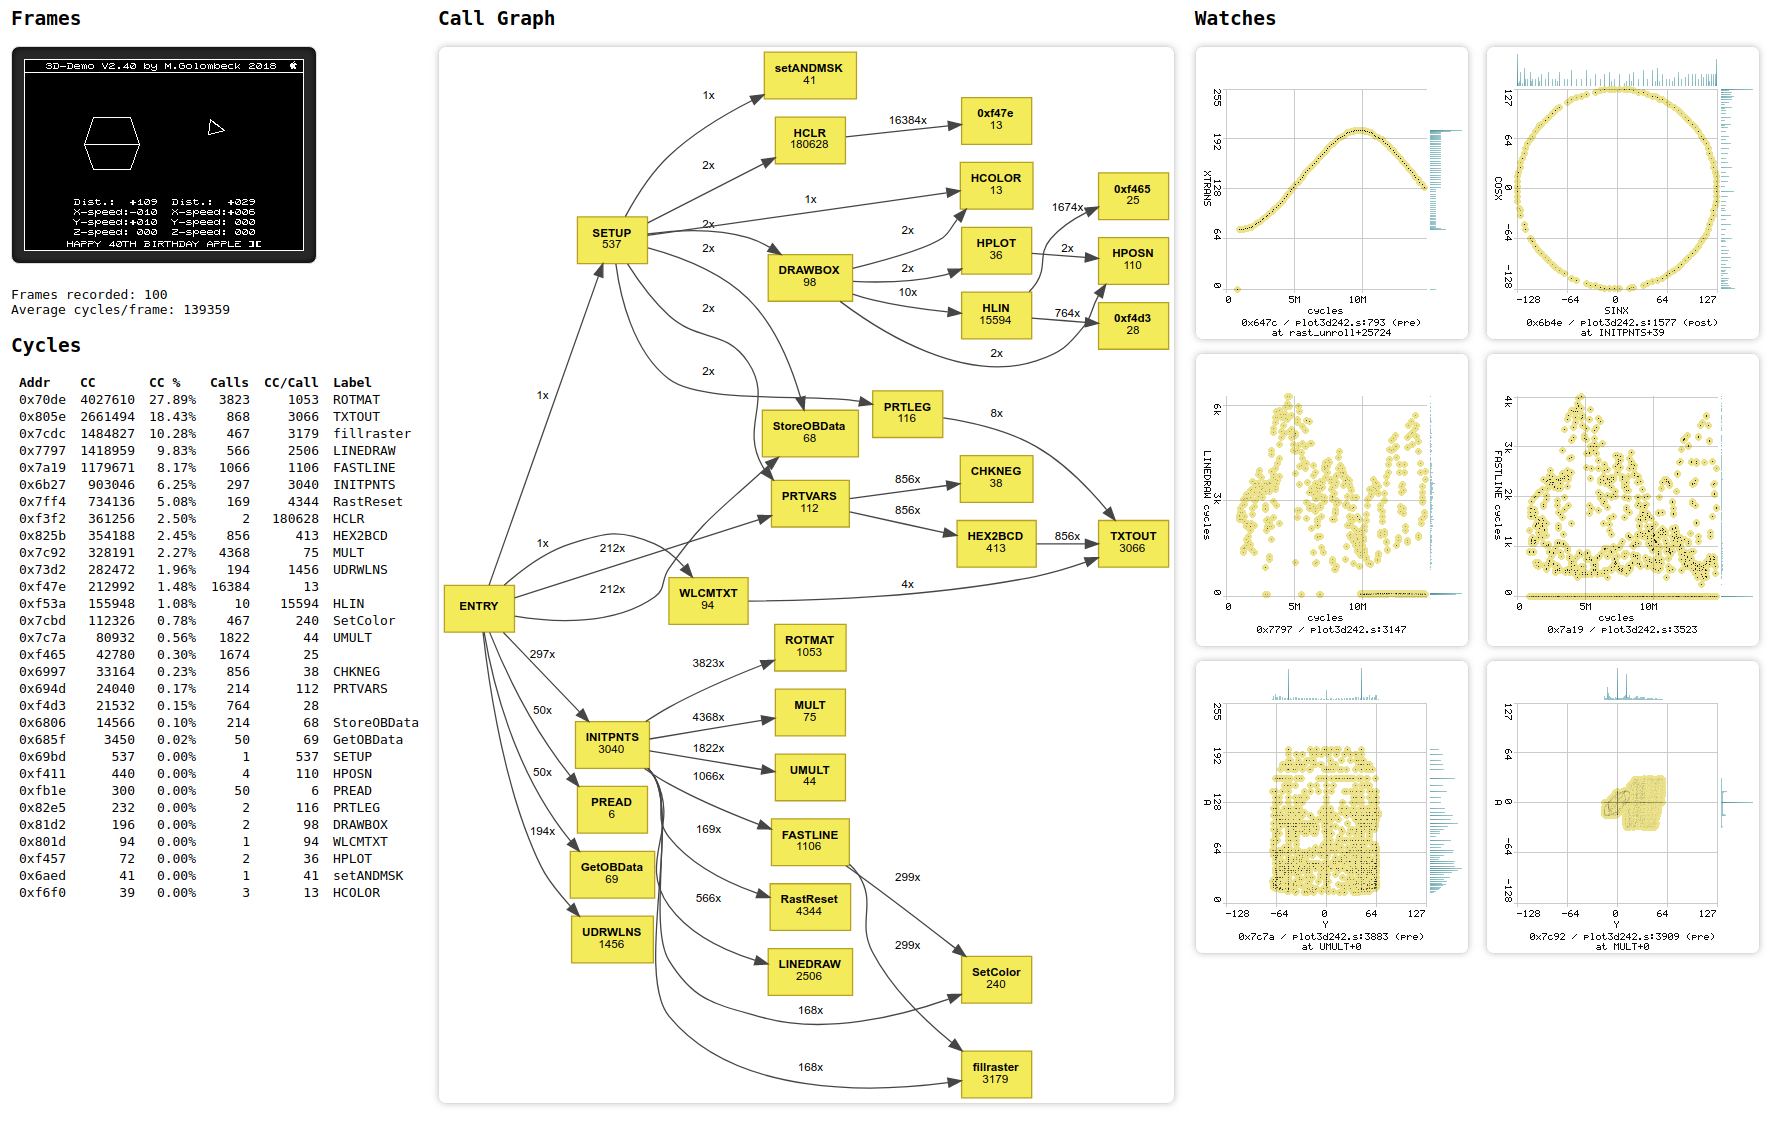
Example report
Defining watches
You can watch registers or variables at certain program counter addresses by inserting a champ directive in a comment after the respective code line in your assembler source code. All champ directives start with an at sign (@). Here's an example (example01.yaml / example01.s):
        DSK test
        MX %11
        ORG $6000

FOO     EQU $8000

        JSR TEST
        BRK

TEST    LDA #64         ; load 64 into accumulator
        ASL             ; multiply by two @Au
        STA FOO         ; store result @Au
        RTS
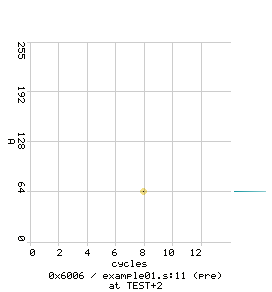
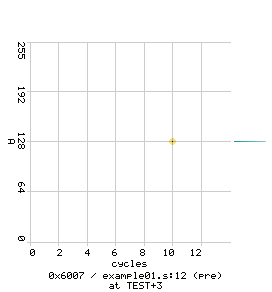
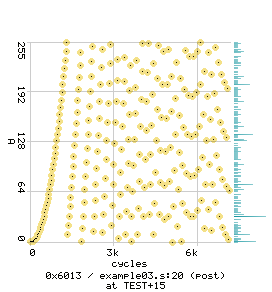
Running this example results in the following watch graphs:
Champ generates a graph for every watch. You can see the watched variable plotted against the cycles, and also the PC address, file name, and source line number of the watch as well as the subroutine in which the watch was defined. At the right border you can see a histogram of the variable, which is pretty minimal in this example but may look more interesting in other cases.
With the @Au directive, we tell champ to monitor the A register and interpret it as an unsigned 8 bit integer (likewise, @As would treat the value as a signed 8 bit integer).
By default, all champ values get recorded before the operation has been executed. To get the value after the operation, you can write: @Au(post). Feel free to add as many champ directives as you need in a single line, each starting with a new at sign.
Global variables
In addition to watching individual registers, you can also watch global variables (example02.yaml / example02.s):
        DSK test
        MX %11
        ORG $6000

FOO     EQU $8000       ; @u16

        JSR TEST
        BRK

TEST    LDA #0
        STA FOO
        LDA #$40
        STA FOO+1       ; @FOO(post)
        RTS
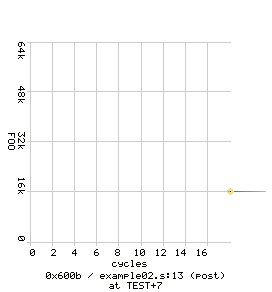
Here, we declare the type of the global variable in the same place the variable itself is declared, using u8, s8, u16, or s16 to declare the type. Later, we can just watch the variable by issuing a champ directive like @FOO. In this example, we use the (post) option to see the variable contents after the STA operation.
Here's another example with some more interesting plots (example03.yaml / example03.s):
        DSK test
        MX %11
        ORG $6000

FOO     EQU $8000 ; @u8

        JSR TEST
        BRK

TEST    LDX #$FF
        LDA #1
LOOP    TAY
        TXA
        EOR #$FF
        LSR
        LSR
        STA FOO
        TYA
        CLC
        ADC FOO     ; @Au(post)
        DEX         ; @Xu(post) @Au,FOO(post)
        BNE LOOP
        RTS
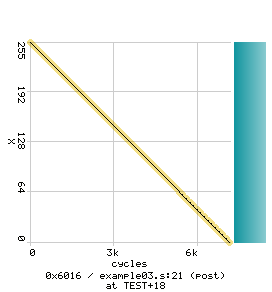
This is a small program which lets the accumulator grow exponentially while X decreases linearly:
Two-dimensional watches
We can also watch pairs of variables by separating them with a comma in the champ directive:
DEX ; @Xu(post) @Au,FOO(post)
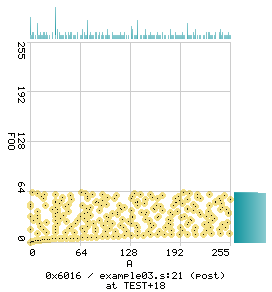
This will plot FOO against A:
Subroutine cycle watches
If you want to know the distribution of cycles spent in certain subroutines, use the @cycles directive to add a watch for this information (example04.yaml / example04.s):
        DSK test
        MX %11
        ORG $6000

        LDX #$20
        JSR COUNT
        LDX #$30
        JSR COUNT
        LDX #$40
        JSR COUNT

        BRK

COUNT   DEX         ; @Xu(post) @cycles
        BNE COUNT
        RTS
Please note that this will only yield data for labels which actually get called via JSR at some point in the program.
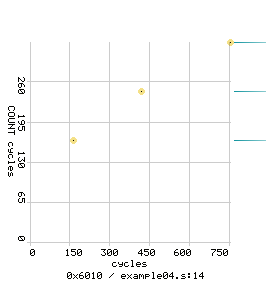
This programm calls the COUNT subroutine three times with different X arguments, and we get both X and the number of cycles spent in COUNT:
We see the three incantations of COUNT with X decreasing to 0 each time, and at the end of every loop, the amount of cycles spent in COUNT.
Disabling watches
To disable a watch, add a ; right behind the @:
ADC FOO ; @;Au(post)
Did you know?
By the way, there's a full-fledged, incremental, standalone, no-dependencies GIF encoder in pgif.c that writes animated GIFs and uses some optimizations to further minimize space. It's stream-friendly and as you feed pixels in via stdin, it dutifully writes GIF data to stdout until stdin gets closed.
